Related Plugins and Tags

QGIS Planet

History of QGIS Committers

Using the git log leading up to the 1.7 release (June 2011) I put together a graphic that shows the growth of committers working on the project.

QGIS Committers over Time


In 2002 we had two people (me alone up until October). You can see significant jumps in developer interest in 2004 and 2008:

  • In 2004 there were a number of releases that added significant functionality
  • Following an announcement at FOSS4G 2007 in Victoria we released 0.9 which included Python support. This opened up plugin development to a whole new group of people and contributed to growth in 2008

The graphic includes all committers including documentation writers, translators, and developers. In addition, it doesn’t cover the whole spectrum of people who have contributed code and patches that were applied by project developers. There are a lot more people involved in the care and feeding of QGIS than the 46 represented on the graph.

What does it mean? QGIS continues to see growth and interest from the development and user communities. It will be interesting to see if we get a new bump following the just concluded FOSS4G conference in Denver.

Visualizing QGIS code activity between 1.6 and 1.7 – Video

Here is a quick video I did this morning using the very cool tool Gource. The video shows all the commits (1265) that were made between release 1.6 and 1.7. QGIS 1.7 was released on 19th June 2011 but there was still some clean up in the 1.7 branch paste that date into September.

It’s interesting to note the large burst of activity around November.


Filed under: Open Source, qgis Tagged: FOSSGIS, gis, git, Gource, Open Source, qgis, Quantum GIS

QGIS Tips – Custom feature forms with Python logic

Last week I found a nice little undocumented feature of QGIS. I plan on writing documentation, so it won’t stay that way for long but I thought I would post about it first and run though it step by step.

This post is going to be a follow up post based on what Tim Sutton did for the same subject back in 2009 at http://linfiniti.com/2009/11/creating-dynamic-forms-a-new-feature-headed-for-qgis-1-4/

For data entry one feature I really like in QGIS is the automatic feature edit forms with support for textboxs, dropdowns and all sorts of other cool Qt controls to make data entry a breeze.

However one thing that people might not be aware of is that you can have a custom forms for data entry. QGIS will take care of setting all the fields and then saving the values back to your layer.

This could be handy if you want to have say a logo, some validation and maybe some text to help the user fill in the form correctly. Or just a custom form layout because you can.

One thing Tim didn’t follow up on was a post about how to add custom Python logic to the form, which I think is the coolest feature of having these custom forms.

So lets get started.

Creating the custom form

This process is pretty much the same as what Tim outlined in his blog post however I’m going to go over it again for completeness.

In order to create the custom form you will need to install Qt Desinger. For windows I haven’t found a way to just install the desinger although if you have QGIS installed it is normally installed with the Qt framework and can be found at C:\OSGeo4w\bin\designer.exe. If you’re on Linux you can run something like

sudo apt-get install qt4-designer

Ohh how I wish windows had a package management system :(

Fire up Qt Desinger and select “Dialog with Buttons Bottom”.

Lets throw on a couple of Labels and a few Line Edits for the data. Now set the form to use a Grid Layout (Right Click on empty space on form->Layout->Layout in Grid).

Now the trick in making a custom form for QGIS is naming the object the same as the field. So I my case I have a road layer with the following fields.

- Segment_ID
- Parcel_ID
- Name
- Alias_Name
- Locality
- Parcel_type

For my custom form I only care about Segment_ID and Name, so my form looks like:

Custom form in Qt Designer

Note that I have set the read only property of the Segment ID line edit to True so that it can’t be edited. I don’t want people messing around with the ID.

As I said above the tick is in the naming so right click on each line edit and select Change objectName, naming each line edit using the same name as the field. For me the first control is called Segment_ID and the other is called Name.

Make sure the objects are the same name as the field.

Save the form into a new folder, I have put mine in C:\Temp\Roads. Jump back into QGIS, load the properties dialog for the layer. Select the General tab and set Edit UI to the new form .ui file.

Setting the edit form UI file.

Save and exit the properties window. Enable the layer for editing (or not) and select an object with the Identify Feature tool.

Woot! Custom edit form in QGIS.

Magic! As I’m in edit mode any changes I make to the Name line edit will be reflected back on the layer (but not the Segment ID as it’s read only). If you are in non-edit mode then you are given the custom form with everything disabled and a cancel button.

With Python validation and custom logic.

Now creating a custom form like above is pretty cool although having some custom Python validation behind it would be even cooler.

What I want to do is add some validation to the Name field so the user can’t enter null road names.

First save your QGIS project (as the Python code runner will look where the project is saved for the Python module). Again I have saved mine in C:\Temp\Roads as Roads.qgs. Now lets make a new python file in your favourite text editor and add the following code.

from PyQt4.QtCore import *
from PyQt4.QtGui import *

nameField = None
myDialog = None

def formOpen(dialog,layerid,featureid):
	global myDialog
	myDialog = dialog
	global nameField
	nameField = dialog.findChild(QLineEdit,"Name")
	buttonBox = dialog.findChild(QDialogButtonBox,"buttonBox")

	# Disconnect the signal that QGIS has wired up for the dialog to the button box.
	buttonBox.accepted.disconnect(myDialog.accept)

	# Wire up our own signals.
	buttonBox.accepted.connect(validate)
	buttonBox.rejected.connect(myDialog.reject)

def validate():
  # Make sure that the name field isn't empty.
	if not nameField.text().length() > 0:
		msgBox = QMessageBox()
		msgBox.setText("Name field can not be null.")
		msgBox.exec_()
	else:
		# Return the form as accpeted to QGIS.
		myDialog.accept()

Wow! What the hell is all that! I’ll step though the code to explain each bit.

Code break down.

First import the modules from Qt and set up a few global variables to hold the dialog and name field.

from PyQt4.QtCore import *
from PyQt4.QtGui import *

nameField = None
myDialog = None

Now we create a method that QGIS will call when it loads the form. This method takes an instance of our custom dialog, the Layer ID, and the Feature ID.

def formOpen(dialog,layerid,featureid):

Then using the findChild method we want to grab the reference to the Name field and the button box. We are also calling buttonBox.accepted.disconnect() to disconnect the slots that QGIS has auto wired up to our button box, we do this so we can hook up our own accepted logic.

After we have disconnected the accepted signal we can wire up our own call to the validate method using buttonBox.accepted.connect(validate).

global myDialog
myDialog = dialog
global nameField
nameField = dialog.findChild(QLineEdit,"Name")
buttonBox = dialog.findChild(QDialogButtonBox,"buttonBox")

# Disconnect the signal that QGIS has wired up for the dialog to the button box.
buttonBox.accepted.disconnect(myDialog.accept)
# Wire up our own signals.
buttonBox.accepted.connect(validate)
buttonBox.rejected.connect(myDialog.reject)

We need a method to validate the logic. This will be called when the signal buttonBox.accepted() is called. The logic in this method should be pretty streight forward. If the Name line edit has a length > 0 then we accept the dialog, if not then we give the user a message and let them fix the mistake.

def validate():
  # Make sure that the name field isn't empty.
	if not nameField.text().length() > 0:
		msgBox = QMessageBox()
		msgBox.setText("Name field can not be null.")
		msgBox.exec_()
	else:
		# Return the form as accpeted to QGIS.
		myDialog.accept()

Almost done!

Now that you have a Python file with the custom validation logic we need to tell QGIS to use this logic for the form. First save the Python file in the same directory as your project. I have called mine C:\Temp\Roads\RoadForm.py.

Back on the General tab in the layer properties we can set the Init function field. We set this to call the module and function we just made. The syntax is {module name}.{function name}. In my case my module (the Python file we made before) is called RoadForm and the function is called formOpen, so it will be RoadForm.formOpen.

Set the Init function field to moduleName.functionName

Save and use the Identify Feature tool to select a feature. You shouldn’t get any errors if everything worked ok. Now delete everything in the Name field and hit Ok.

Validation in action

Sweet! The form can now not be accepted if the name field is null.

And that’s that. Pretty simple but powerful feature once you know how to set it up.

Enjoy!

If you do end up using this custom form with python logic stuff in the real world, leave a comment and maybe a picture. It would be good to see use cases for this cool QGIS feature.

Bonus

Why not add a red highlight to the textbox if something is not valid.

from PyQt4.QtCore import *
from PyQt4.QtGui import *

nameField = None
myDialog = None

def formOpen(dialog,layerid,featureid):
  global myDialog
  myDialog = dialog
  global nameField
  nameField = dialog.findChild(QLineEdit,"Name")
  buttonBox = dialog.findChild(QDialogButtonBox,"buttonBox")

  nameField.textChanged.connect(Name_onTextChanged)
  # Disconnect the signal that QGIS has wired up for the dialog to the button box.
  buttonBox.accepted.disconnect(myDialog.accept)
  # Wire up our own signals.
  buttonBox.accepted.connect(validate)
  buttonBox.rejected.connect(myDialog.reject)

def validate():
  # Make sure that the name field isn't empty.
  if not nameField.text().length() > 0:
    nameField.setStyleSheet("background-color: rgba(255, 107, 107, 150);")
    msgBox = QMessageBox()
    msgBox.setText("Name field can not be null.")
    msgBox.exec_()
  else:
  # Return the form as accpeted to QGIS.
    myDialog.accept()

def Name_onTextChanged(text):
  if not nameField.text().length() > 0:
    nameField.setStyleSheet("background-color: rgba(255, 107, 107, 150);")
  else:
    nameField.setStyleSheet("")

The key part of of this is nameField.textChanged.connect(Name_onTextChanged) and the Name_onTextChanged(text) method. Give it a try, I think it looks quite nice.

Change text background to red on invalid input.


Filed under: Open Source, qgis Tagged: FOSSGIS, gis, Open Source, qgis, qgis-editing, Quantum GIS

New Tool: MapInfo to QGIS style converter

Hopefully this tool can be of some use to people, as I know it has been very helpful to me since I made it.

As I’m a pretty heavy QGIS user now, and my work place still stores most, if not all, of our data MapInfo TAB format, one  friction point for me using QGIS was having to restyle all the MapInfo layers.  If we only had a handful of layer this wouldn’t be such a pain but we have a lot of tables and it would take me months to go though each one manually and style them.

I thought “there has to be some way I can automate this…” and so the MapInfo To QGIS Style Generator (or mapinfoToQgis.py) was born. Knowing that QGIS uses QML (a XML file format) to store it style information, and that MapInfo was able to export a style string for each object, I compared what QGIS generated for its QML using the same symbol I picked in QGIS as I had in MapInfo.   Almost a 1 to 1 conversion! Once I worked out how to convert MapInfo point size  to QGIS symbol size, and MapInfo colour value to RGB it was just a matter of generating a QML with the correct values.

Long story short, after a bit of clean up and writing a user guide I would like release version 0.1 of the MapInfo To QGIS Style Generator for wider testing.

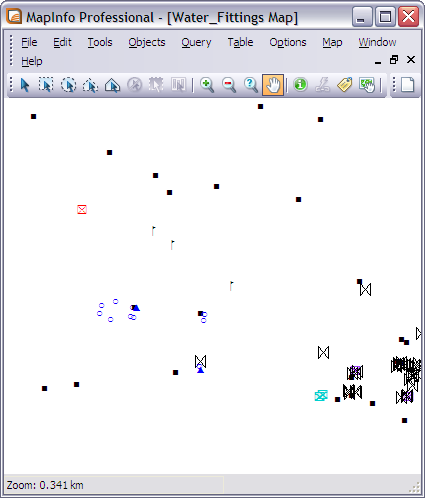
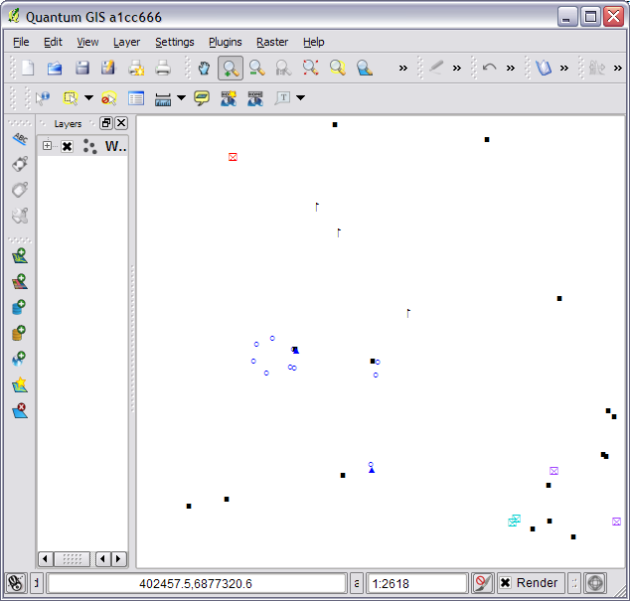
Here is a quick example of the output.

Step 1: Take One MapInfo table.

Step 2: Run it though mapinfoToQgis.py

python mapinfoToQgis.py WaterFittings.Tab WatterFittings.qml -c FittingType --UseMapInfo

Step 3: Load QML file in QGIS

Result from running mapinfoToQGIS.py

Step 4: Get a beer?

If you are using MapInfo Font symbols or normal MapInfo 3.0 everything should come across almost exactly. mapinfoToQgis.py will use the same fonts in QGIS as you did in MapInfo and select to the correct symbol size. Although if you are using custom MapInfo 3.0 symbols you will get the default QGIS black square symbol,you can just change it to something better after loading the QML.

Currently the program only support converting symbols but I plan on adding line and region support sometime in the future.

The program can be found at https://github.com/NathanW2/MapInfo-to-QGIS-style-generator and more detailed instructions and download link can be found at https://github.com/NathanW2/MapInfo-to-QGIS-style-generator/wiki/Using-MapInfo-to-QGIS-style-generator.

Like I said at the start, hopefully other people will find this tool handy as I know I have.  If you do find it handy let me know, I would love to hear peoples feedback.  Also if you find any bugs let me know in the comments or log a issue on https://github.com/NathanW2/MapInfo-to-QGIS-style-generator/issues

Enjoy :)


Filed under: MapInfo, Open Source, qgis, QGIS for MapInfo Users Tagged: gis, mapinfo, MapInfo Professional, mapping, Open Source, qgis, qgis-vs-mapinfo, Quantum GIS, styling

Slow opening of rasters in QGIS 1.7? Here is a fix.

Note: The following post only applies to QGIS 1.7.  QGIS 1.7.1 (upcoming patch) will not have this issue as the default behavior has changed. 

One thing I noticed when running QGIS 1.7 was my rasters were really slow to open and sometimes froze QGIS.  I thought maybe it was some bad plugin that I had installed, nope; maybe opening the raster of the network drive was causing it to be slow, nope. I tried a bunch of stuff, still nothing.  After a while a few other people posted to the mailing list saying they were having the same issue, turns out the solution was very simple.

In QGIS contrast enhancement for rasters is turned on by default, so each time a raster is opened QGIS had to calculate the stats (max and min for example) for the raster and then scale the contrast.  For a large raster this is pretty heavy and this was the cause of all those problems.

So what’s the solution?

Turns out QGIS will remember the contrast setting for all rasters if you want it to.

To fix the slow opening raster problem:

  1. Open a small raster (just any old picture will do)
  2. Double click the layer in the layer list
  3. Change Contrast Enhancement to No Stretch

    Change Contrast Enhancement to No Stretch

  4. Hit the little Save icon next to the drop down box
  5. Open your big raster.

That setting will now be remembered for each raster that is opened and improve the loading time.

On a similar note.  Tim over at http://linfiniti.com has done some work to improve the raster performance even more with http://linfiniti.com/2011/08/improvements-to-raster-performance-in-qgis-master/ .  The improvements that  Tim has made are available in the nightly build of QGIS via qgis-dev in OSGeo4W, or by building the master line from github.com.


Filed under: Open Source, qgis Tagged: FOSSGIS, gis, Open Source, OSS, QGIS 1.7, Quantum GIS, rasters

QGIS edit tools brainstorming or What edit tools should QGIS have?

One trend that come up a lot in the poll I recently ran (results will be out soon, just writing a summary blog post) is “Needs more powerful edit tools“.  And I agree.

Coming from a MapInfo background nothing much changes when you move to QGIS, MapInfo had the simple Add Point, Add Region, Add Line kind of tools and then you need to use plugins to do anything a bit more advanced (MapCAD).  QGIS has the start of a kind of MapCAD thing happening although not as complete.

Why not just let people write plugins?

However I think in order to make QGIS a more attractive package to a lot of people it needs to get some built in semi-advanced to advanced editing tools;  getting back to those poll results of “Needs more powerful edit tools”.

I thought to myself “What would I like QGIS to be able to do when it came to editing?” although I came up with a small set my editing needs are only relatively small.  I then thought the best way to find out what people need is to just create a blank canvas for people to throw their ideas around on and then go from there.

Why not just create a ticket?

My idea is to get a larger idea of what people need and want rather than just one-off tickets. Although the ideas will be at the edit tool idea level it will be easier to see how they should all fit together if they are all in one place and editable by other people.  You can then start asking questions like: Do we really need that UI there?  Can we merge these tools?  How should the output be handled?

The overall goal is to have a tight, thought out, group of edit tools rather then someone creating a plugin over here for one thing and some else creating something else over there.

So how do we get this going?

Well I have created a Google Document that anyone can edit and view in order to start brainstorming ideas. The link can be found here.

I have already created an example of two ideas that I would like to see.

So go ahead, throw some ideas up.  I’m interested to see where this can head.

Why use Google Docs and not the QGIS wiki?

Mainly because Google Docs makes it very easy to do frictionless editing of a document together.  No need for user names or passwords or overwriting someone else’s changes (Google Docs is all real time).


Filed under: Open Source, qgis Tagged: FOSSGIS, gis, mapping, Open Source, OSS, poll, qgis, qgis-editing, Quantum GIS

Add yourself to the QGIS user map

If your a QGIS user, and you haven’t done so already, how about consider adding yourself to the QGIS user map at http://planet.qgis.org/community-map/. So far there are 604 user mapped

QGIS User Map

although Australia doesn’t look like it has many users…….yet.

QGIS user map Australia

So if you are a QGIS user (full time or part time) it would be good to see your location on the user map esp if you are in Australia :)


Filed under: Open Source, qgis Tagged: gis, Open Source, qgis, Quantum GIS

Changing the QGIS application style on Windows

By default QGIS uses the Qt QPlastiqueStyle for all its windows which makes QGIS render all controls like this:

Default style for QGIS on windows.

However it can be changed in order to make it fit in with system style, as in use Windows style. Running the following commands in the python console:

from PyQt4.QtGui import QApplication
QApplication.setStyle("windowsvista")

will change QGIS to render controls in windows style:

QGIS using windows style.

It’s quite hard to notice many of the differences but just try it you will see them

However there is one limitation. QGIS will not remember that setting as the compiled binary forces QGIS running on Windows into QPlastiqueStyle.

I have started working on a patch to give the user a choice in the options which control rendering style they would like to use. I think choice in these situations is good because I have grown to like the QPlastiqueStyle, mainly because I have used it so much , but other people I know prefer the Windows Vista style controls.


Filed under: Open Source, qgis Tagged: gis, Open Source, qgis, Quantum GIS

Browser Wars: QGIS vs MapInfo 11

Warning: This post contains small rants! You have been warned.

PBBI have recently released MapInfo 11, the new version has brought one change that I think deserves some attention – even if for the wrong reasons.

MapInfo’s browser window was in need of a very good make over; it didn’t follow normal keyboard conventions, eg holding shift to select rather than ctrl; couldn’t sort via the headers; keyboard navigation was poor; and it looked ugly. PBBI then announced that MapInfo 11 would have a new “improved” browser. I thought “Sweet! About time” and then we got a copy. /sigh

So what’s the problem?

First off it’s slow to resize, this would be due to them using .NET WPF for the new browser (I have never seen a good fast .NET WPF datagrid).

Then we have sorting, which is meant to be the cool new feature. This is not the normal just click on the header to sort the column, no because that would be too easy, you have to right click in the browser, click sort and select the options which then opens a new browser window. um what?

Yes this is a pretty handy feature but no it shouldn’t be the only way to sort, you should have a click on the header kind of sort. This seems to be what people wanted.

Next. No visible scroll progress. When you move the little scroll box on the side the browser waits until you have finished to show you the data. I guess the old browser did this too so why change it!

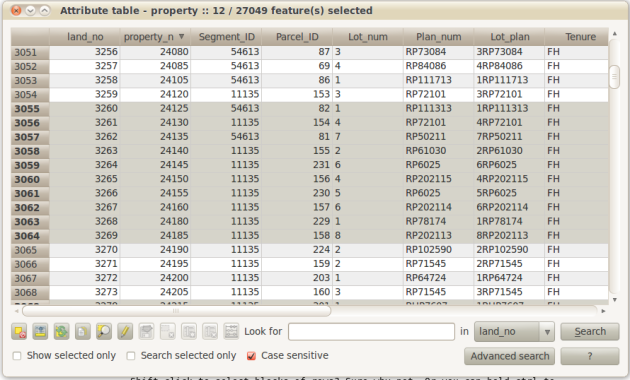
And finally shift click to select a block of rows doesn’t work, I mean come on this is not a hard thing to do.

Surly you can dock it? Nope!

In the end we have a browser that is pretty much the same as the old one but slower……oh and has alternating row colors.

Overall reaction: Disappointed

Enter QGIS

Now if you are reading this blog you are well aware that I am a huge fan of QGIS, I don’t really make that a secret. So I guess the overall point of this post is to compare the QGIS attribute table (browser) and the new MapInfo 11 one.

Lets run though the same list as MapInfo.

Slow to resize? Nope. Even with a large table open the resize speed doesn’t change.

Header based sorting? Yep. Just click the header and it will sort that column. Multi column sorting is on the to-do list.

Live scrolling (results update as you scroll)? Yep + no lag.

Shift click to select blocks of rows? Sure why not. Or you can hold ctrl to select rows all over the grid.

Docking? Yep and floating so you can put it on a different monitor if you need.

Bonus

The QGIS attribute table has a built-in search/filter box, saves having to run a query and have a new window like in MapInfo if you just want to filter the browser.

The QGIS attribute table (browser)

Extra Bonus
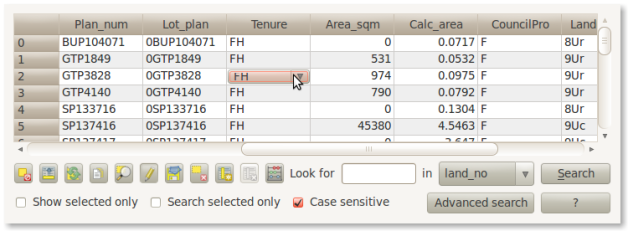
The QGIS browser can even have other UI objects inside the cells. Very bloody handy.

Combo box in browser table.

You can even have a calendar date picker if you want.

Lets review

Feature MapInfo 11 QGIS
Good resize speed. No Yes
Header sorting. No Yes
Multi column sorting. Yes [1] No [2]
Live scrolling. No Yes
Shift click for blocks of rows No Yes
Docking. No[3] Yes

[1] Why does it need to open a new browser window? At least make it an option.
[2] On the to-do list

[3] Yes you can use http://www.pbinsight.com/support/product-downloads/item/windowhelper for this support. It’s a good tool made by a guy at MapInfo go and download it. I just think it should be built in.

Doesn’t look too good for MapInfo at the moment. QGIS is even accessing the TAB data though ogr. Quick tip: if a free program can access and manage your data faster than you, you are failing.

My work place spends a good deal of money on our annual MapInfo “maintenance” licence, money I would happily send to the QGIS project if I had the choice. Or at least part of it,

Data

Both programs opened a 27000 row .TAB file.

Just for the record I’m not anti-MapInfo. It still has some features that I really like. I just wish they would pick up the game.


Filed under: MapInfo, Open Source, qgis, QGIS for MapInfo Users Tagged: .NET, Feature Requests, mapinfo, MapInfo Professional, mapinfo-11, Open Source, qgis, qgis-vs-mapinfo, Quantum GIS

A QGIS user poll

I have just whipped up a small user poll for QGIS users. The poll is just to give me (and indirectly the team) some idea of people’s opinions about QGIS and what it could do better. The poll is only short (9 questions) and one of the main things is “What could QGIS do better?”.

The poll can be found here: https://spreadsheets.google.com/spreadsheet/viewform?formkey=dDA5TW96Z19aNFU1OVpzSzFyRzFybmc6MQ

All the answers are anonymous so feel free to say what you like about anything. In the end if something isn’t working the way you think it should, write it down. It’s not going to hurt anyone’s feelings :)

If you are a partial QGIS users who mostly uses MapInfo or ESRI stuff I would also like to get your opinion.


Filed under: Open Source, qgis Tagged: gis, mapinfo, mapping, Open Source, OSS, poll, qgis, Quantum GIS

Another cool open source project – OSGeo-Live

Another cool open source project that I have become a part of (as a QGIS packager and tester) is the OSGeo-Live project.  The OSGeo-Live project is a live DVD/USB/Virtual Machine built on xUbuntu(striped down Ubuntu linux) that has a lot of cool open source geo spatial programs all set up and ready to use.

The OSGeo-Live project contains:

  • Browser clients
  • A small sample of crisis management software
  • All the popular database engines (PostGIS, SpaitalLite etc)
  • Pretty much all the open source desktop GIS apps (QGIS, uDig etc)
  • Open Source GPS navigation apps and globes.
  • A collection of handy spatial tools
  • A ready to go web services ready to try in your browser or desktop GIS.
  • Some sample data to get started with for each project
  • And quick starts for each program.

The full list of software contained on the OSGeo-Live project can be found at http://live.osgeo.org/en/overview/overview.html

This is a good project if you want to get into the OSGeo tools and experiment but don’t want to install them on main machine until you know what you need.

As it is a live DVD/USB/Virtual Machine some apps will run slower than what they do on a native install but overall the speed is usable and good enough for testing.

Even better is that it was born in Australia :)

The project is also commercial supported by a Australian company http://lisasoft.com

So give it a try if you are interested in the OSGeo movement, which you should be if you are reading my blog :)


Filed under: Open Source, qgis Tagged: gdal, gis, mapping, Open Source, osgeo, osgeo-live, OSS, Quantum GIS

Fresh off the press – QGIS 1.7 is released!

Tonight Tim Sutton officially made the release announcement for QGIS 1.7, so I’m guess I’m free to blog about the newest version now and its cool features.


What are you still doing here? Go and get it! http://www.qgis.org/wiki/Download

I am, as a heavy QGIS user and a guy-who-tries-to-write-features-and-patches-for-the-code, very happy with this release. I know a lot of people have put a lot of hard work and free time into working on features and bug fixes that keep making this free GIS system even better.

Some of the more notable new features in this release are…well there are just way to many for me to list here so go and check out the official list at http://qgis.org/component/content/article/127-qgis-1-7-release.html

The QGIS team has shifted their source control system to using GIT, which I am very happy about as a lot of the guys on the #qgis IRC channel will know :). The bug tracer has also been moved tohttp://hub.qgis.org/projects/quantum-gis.

Since the release of QGIS 1.6 there have been 1199 commits (using git to count: git log –pretty=oneline upstream/release-1_6_0..upstream/release-1_7_0 | wc -l). Not a bad effort if I may so myself.


If you are still reading this, I really hope it’s because you are waiting for QGIS 1.7 to install.


Filed under: Open Source, qgis Tagged: gis, git, mapping, Open Source, OSS, qgis, Quantum GIS

Opening MS SQL Server 2008 Spatial tables in QGIS – Correctly

Turns out the last blog post I did on this subject contained a few errors, mainly that QGIS wouldn’t render the layer when you opened it.

The answer is so obvious it’s almost embarrassing :)

In order to open and display a SQL Server 2008 layer in QGIS correctly, via OGR, you must have a geometry_columns table in your database with the name, geometry type and srid of the layer. That’s it! Oh look, it was even right in front of me in the OGR code for the mssqlspatial driver.

int OGRMSSQLSpatialTableLayer::FetchSRSId()
{
    CPLODBCStatement oStatement = CPLODBCStatement( poDS->GetSession() );
    oStatement.Appendf( "select srid from geometry_columns "
                    "where f_table_schema = '%s' and f_table_name = '%s'",
                    pszSchemaName, pszTableName );

    if( oStatement.ExecuteSQL() && oStatement.Fetch() )
    {
        if ( oStatement.GetColData( 0 ) )
            nSRSId = atoi( oStatement.GetColData( 0 ) );
    }

    return nSRSId;
}

So the process to open a MS SQL 2008 spatial layer in OGR is as follows.

There are two main tables which tell OGR how to read a layers projection:

  • geometry_columns
  • spatial_ref_sys

geometry_columns contains the table name and the key for the table spatial_ref_sys which contains the projection string. The projection string is the info that QGIS needs in order to correctly render a layer.

The easiest way to get the correct tables is to let OGR handle it for you via ogr2ogr, then just adding any other tables you may have already in your database to the geometry_columns table.

So to get ogr2ogr to create the right tables for you it’s as simple as running the following command from inside the OSGeo4W shell, changing the connection string part of course:

ogr2ogr -overwrite -f MSSQLSpatial "MSSQL:server=.\MSSQLSERVER2008;database=geodb;trusted_connection=yes" "rivers.tab"

(sample taken from http://www.gdal.org/ogr/drv_mssqlspatial.html)

Uploading even just one table this way will create both tables and fill in the needed info.
The geometry_columns table:

f_table_catalog f_table_schema f_table_name f_geometry_column
geodb dbo rivers ogr_geometry
coord_dimension srid geometry_type
2 32768 POLYGON

The spatial_ref_sys table:

srid auth_name auth_srid srtext proj4text
32768 NULL NULL PROJCS[“UTM_Zone_56_Southern_Hemisph…. +proj=utm +zone=56 +south +ellps=GRS80 +units=m +no_defs

So if you have already existing tables in your MS SQL 2008 database that were loaded, via say MapInfo’s EasyLoader, you would just upload one table via ogr2ogr to create the two tables needed by QGIS(using OGR) and then add the other tables to the geometry_columns table. If they are all in the same projection than you are in luck as you will only need to upload one in order to get the right strings in the spatial_ref_sys table, if not just upload a small sample for each projection.

Then you can open the table in QGIS using:

uri = "MSSQL:server={serverName};database={databaseName};tables={tableName};trusted_connection=yes"
qgis.utils.iface.addVectorLayer(uri,'{yourLayerNameHere}','ogr')

Tip: In order to test you have correctly set the table in geometry_columns you can run another ogr tool ogrinfo:

ogrinfo -al "MSSQL:server=localhost;database={your database};tables={your table}" -fid 1

If you see a value in Layer SRS WKT: then chances are it’s set right and QGIS should be able to render it, however if you see: Layer SRS WKT:(unknown) Than chances are QGIS will not render it correctly.

Hopefully this help people use MS SQL 2008 Spatial with QGIS, a important step I think in the world of using QGIS on Windows (especially when you don’t have the freedom to run PostGIS:) ).

I might even do a video tutorial when I get some free time after my exams and my wedding.


Filed under: Open Source, qgis Tagged: gis, map-rendering, mapping, MS SQL Server 2008, MS SQL Spatial, ogr, Open Source, OSS, qgis, Quantum GIS
One of my favorite features of QGIS – Rule based styling.

One of my favorite features of QGIS is the rule based rendering.

QGIS rule based rendering dialog

QGIS rule based rendering dialog

If you’re using MapInfo think of thematics + queries but on steroids. Rule based rendering allows you to you set, well, rules on what gets rendered and how.  The rules are based on a simple SQL style query language that’s built into QGIS.

Take for example the above screen shot.   The screen shot is from a current project I am doing in QGIS to clean up our current stormwater/drainage layer.  The layer is a in a bit of a mess at the moment so I needed a way to visualize what I have cleaned up and what I haven’t, so enter QGIS rule based styling.

For example: A pipe that has an upstream and downstream invert and is part of the trunk (main) network is then considered valid (for this situation anyway), so I created the following rule:

network_type = 'Trunk' AND Description != 'Drainage Imaginary Pipe' AND (US_Invert > 0 AND DS_Invert > 0)

We also have little connecting pipes that I don’t want to include in valid trunk  as they are only used to connect pits to pipes and are just cosmetic, I have excluded them by adding “Description !=’Drainage Imaginary Pipe’” to the above filter.

Next I wanted to show invalid trunk network pipes (ones without an up or downstream invert), so we just invert the last condition and swap the last AND for a OR:

network_type = 'Trunk' AND Description != 'Drainage Imaginary Pipe' AND (NOT US_Invert > 0 OR NOT DS_Invert > 0)

I also need to show but no highlight the non trunk pipes and the connecting pipes, so I made the next two rules and set their styles to a light gray:

NOT network_type = 'Trunk' AND NOT Description = 'Drainage Imaginary Pipe'
Description = 'Drainage Imaginary Pipe'

Finally I want to show pipe direction on all pipes but not the connecting pipes, again as they are just cosmetic:

Description != 'Drainage Imaginary Pipe'

You will also note in the screenshot above that I have a max zoom scales set on the last three rules, this is because when I zoom out all that info becomes overwhelming at that scale and distracts from showing the invalid parts of the main trunk line.

So after all that, the results:

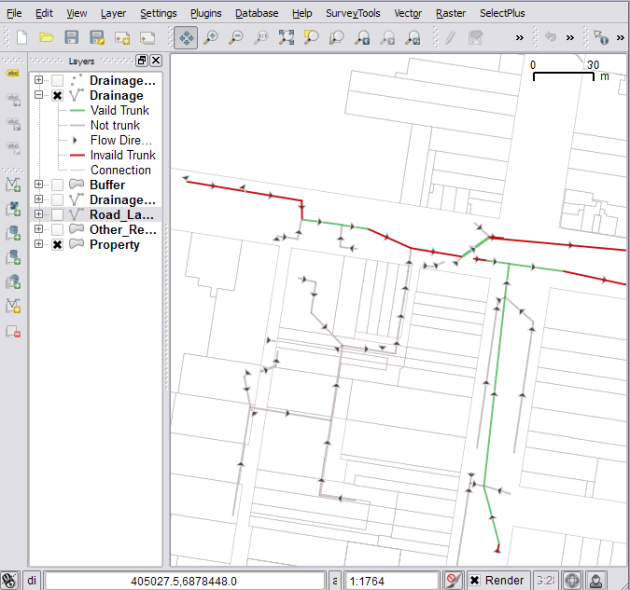
Screenshot of rules applied

Map rendered using rules

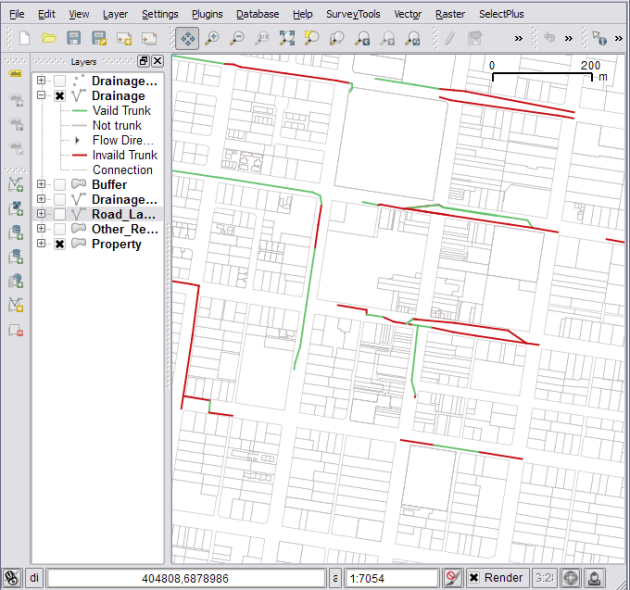
and if I zoom out pass 5,000:

Screenshot of rules applied, zoomed past 5,000

Map rendered when zoomed out pass 5,000

I think you can see how this rule based rendering could be very powerful, in fact I have about four different rule sets I use with the drainage layer to show different things to different people.

The rules I have shown above are pretty simple, you can go pretty crazy and use them to render OpenStreetMap data: http://www.youtube.com/watch?v=NBBYtH2svw0

The worst part about the rule based rendering is that I have gotten so used to their power that I feel crippled when I go back to MapInfo and try to do styling :)

Happy mapping.

What is your favorite QGIS feature?


Filed under: Open Source, qgis Tagged: gis, map-rendering, mapping, Open Source, OSS, qgis, Quantum GIS, styling, thematics

Delete all branches on a github repo

I forked the QGIS repo on GitHub a little while ago although one thing that bothered me was that it gave me copies of all the branches that the main QGIS git repo had.  This is understandable as it’s the way it works however I don’t really need all these branches in my forked copy of the repo as I don’t care about them.   I only care the ones I am working on, and I don’t want to see a big list of branches in my git fork that have nothing to do with me.

So the next question was how do I delete all the branches on the remote repo at GitHub. Well you would normally do:

git push origin :branch_name

although doing that by hand for each branch is, well, a pain in the butt! After a chat with a guy (strk) on the #qgis IRC channel who is more skilled at bash then me (I’m still a Linux noob) he came up with this:

git branch -r | grep origin/ | grep -v master | grep -v HEAD| cut -d/ -f2 | while read line; do git push origin :$line; done;

Very handy.


Filed under: Open Source, qgis Tagged: git, Open Source, OSS, qgis, Quantum GIS
The things I would like to see in QGIS. What are yours?

So if you have not already guessed from my increasing post about QGIS. I really like it as a GIS system but with all systems it comes with its shortcomings. (Nothing that can’t be fixed of course)

Here is my little wishlist of a few things I would love to see in QGIS.

Multipule map canvases. (ArcGIS, MapInfo)

I was thinking more like ArcGIS data frames vs something like what MapInfo has (multiple windows).  I think the multi window system can add confusion for people new to GIS, plus I hate having to window manage.

SQL like interface. (MapInfo)

This is something that I really like from MapInfo.  It adds a lot of power to the application being able to spatially join two tables that don’t share a command link column and get back a new layer.  Adding this to QGIS could be a pretty big task, although a very rewarding one IMO.  

Now there is some credit in saying “well you can just import your data into PostGIS and use that”, however that is not always a option and I think having a layer above that can query any open layer would be very very powerful.

These are just two of the main things that I would like to see, I’ll update the post if I can think of anymore.

Of course being open source I can write the features myself but C++ is still a bit over my head at the moment.

I would love to see what other peoples thoughts, or mini wishlists, are.  So if you are willing, drop a comment and let me know.


Filed under: MapInfo, Open Source, qgis Tagged: Feature Requests, gis, mapinfo, Open Source, OSS, qgis, Quantum GIS

Opening MS SQL Server 2008 Spatial tables in QGIS

EDIT:  If you are having trouble opening MS SQL 2008 in QGIS I will have a blog post coming explaining how to correct it. Or you can read the comments between TheGeoist and I below which will have the answer.

Just a quick tip.

Thanks to GDAL/OGR 1.8 QGIS can now open MS SQL Server 2008 spatial tables via the OGR MSSQLSpatial driver.

First you must be running a version of QGIS that is using GDAL/OGR 1.8.  Opening the QGIS about page will tell you if it is supported.

Need version 1.8 or higher

As I am writing this on my Ubuntu install I only have version 1.6.3 but the latest dev version of QGIS (upcoming 1.7 release) for Windows in the OSGeo4W installer is complied with version 1.8.

Now open the python console in QGIS and type the following:

uri = "MSSQL:server={serverName};database={databaseName};tables={tableName};trusted_connection=yes"
qgis.utils.iface.addVectorLayer(uri,'{yourLayerNameHere}','ogr')

Replacing {serverName} with your server name, if installed on your local machine you can use localhost; {databaseName} with the name of the database with the tables;{tableName} with the table to open; {yourLayerNameHere} with the name you would like the layer to have in the map legend.

After that you should see your MS SQL Spatial table displayed in QGIS, with editing support.

At the moment there is no nice interface in QGIS to open MS SQL tables like there is for PostGIS, although that might be a good plugin project for someone to work on.


Filed under: Open Source, qgis Tagged: gis, mapping, MS SQL Server 2008, MS SQL Spatial, Open Source, OSS, python, qgis, Quantum GIS
Getting ECW and MrSID support working in QGIS dev OSGeo4W install
Note:  This post is about getting ecw and mrsid support working in the trunk (qgis-dev) version of QGIS which is installed with the OSGeo4W installer.  Non-dev versions seem to work fine following this method: http://www.qgis.org/wiki/OSGeo4wSetup#Installing_support_for_raster__.2A.ECW_.28ERMapper.29_and_.2A.sid_.28MrSid.29_formats

Getting ECW and MrSID support into QGIS can be a real pain in the butt when you first try; but once you know how it’s easy.

If you try to open a ecw file in QGIS you will get this nice little error message:

What?  I thought QGIS supported ECW files!

Turns out it does, but the team are not able to ship the required libs with the program due to licensing restrictions by ERDAS.   Luckily adding support is not “too” hard.

  1. First head over to http://www.erdas.com/products/ERDASECWJPEG2000SDK/Downloads.aspx
  2. Click Download Now for the ERDAS ECW/JP2 SDK Desktop Read-Only, Version 4.1 libs,
  3. Fill out a bit of registration details and click though all the pages (this is the most painful process I have ever had to go though to get some libs for a program, ERDAS should be ashamed that it is such an effort.)
  4. Once you have download ECWJP2SDKSetup_RO_20100920.exe; install it.
  5. Copy all the files from C:\Program Files\ERDAS\ERDAS ECW JPEG2000 Read SDK\bin\vc90\win32 into the bin folder of your OSGeo4W install (default is C:\OSGeo4W\bin)
    You can open the OSgeo4W shell and run: copy “C:\Program Files\ERDAS\ERDAS ECW JPEG2000 Read SDK\bin\vc90\win32\*.dll” %OSGEO4W_ROOT%\bin to do the same thing.
  6. Launch osgeo4w-setup.exe, the installer that you used to install qgis-dev,  and select  gdal-ecw, gdal17-ecw and gdal-mrsid, gdal17-sid under the libs section. Let it install the needed libs and any dependencies.
  7. Open %OSGEO4W_ROOT%\bin and search for qgis-dev.bat; open it with a text editor and add the following line:
    set GDAL_DRIVER_PATH=”%OSGEO4W_ROOT%”\bin\gdalplugins\1.8
    I always insert it just after  SET OSGEO4W_ROOT=
  8. Launch qgis-dev.bat
  9. Open a ecw

ECW file opened in QGIS

I have tested this on a couple of machines now but as always

with no guarantee that it will work on yours :)  (Although it should)


Filed under: Open Source, qgis Tagged: ecw, gis, mapping, mrsid, Open Source, qgis, Quantum GIS, raster

Getting total length of selected lines in QGIS via python

The other day I was trying to get the total length of the some selected lines in QGIS. In MapInfo I would just do

Select Sum(ObjectLen(obj,”m”)) from Selection

however QGIS doesn’t have the ability (yet..) to run SQL queries like this, but you can do it via python.

The following is a little python snippet that will get the total length of the selected objects. (You will need to have shapely installed to use)

from shapely.wkb import loads
def getLength():
    layer = qgis.utils.iface.mapCanvas().currentLayer()
    total = 0
    for feature in layer.selectedFeatures():
        geom = feature.geometry()
        wkb = geom.asWkb()
        line = loads(wkb)
        total = total + line.length
    return total

print getLength()

EDIT:Or as Peter asked in the comments, yes you can just call length on the geometry:

def getLength():
    layer = qgis.utils.iface.mapCanvas().currentLayer()
    total = 0
    for feature in layer.selectedFeatures():
        geom = feature.geometry()
        total = total + geom.length()
    return total

print getLength()

Just copy and past that into your QGIS python console and call getLength() when ever you need the total length.

Note: I have found the QgsGeometry .legnth() function to be unstable in the past and it has crashed my QGIS instance. Just test it first, if not you can always use the shapely method.


Filed under: Open Source, qgis Tagged: gis, mapping, Open Source, python, qgis, Quantum GIS, shapely

Picture: MapInfo to QGIS Styling

Just a quick one.

This afternoon I was having a go at getting our work MapInfo layers to look the same in QGIS as they do in MapInfo.  I wanted to do this; 1) So I can print maps from both systems for people and they are a consistent style 2) Would rather use QGIS for every day map work.  3) To see what they compare like.    I think it came out pretty good, apart from few symbols that I didn’t get time to finish.

MapInfo vs QGIS

Note that MapInfo has anti-aliasing and transparency  turned off, as it makes MapInfo very slow and render any output as bitmaps rather than vectors (poor).  Where as QGIS is using both, as it doesn’t suffer from the same problems.

EDIT: To be fair here is both with the best settings turned on.  They are pretty much the same, which is a good thing.


Filed under: MapInfo, Open Source, qgis Tagged: mapinfo, mapping, Open Source, qgis, Quantum GIS

  • <<
  • Page 3 of 4 ( 69 posts )
  • >>
  • quantum gis

Back to Top

Sustaining Members